


Phoenix, AZ (August 9, 2018) – A statewide survey by Data Orbital shows that Arizona voters overwhelmingly reject the elimination of current border security. The latest survey was conducted from August 7-8, 2018 and polled 550 likely General Election voters across Arizona. 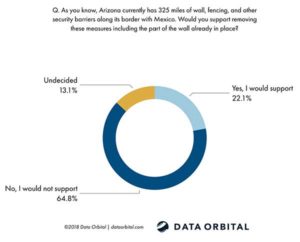

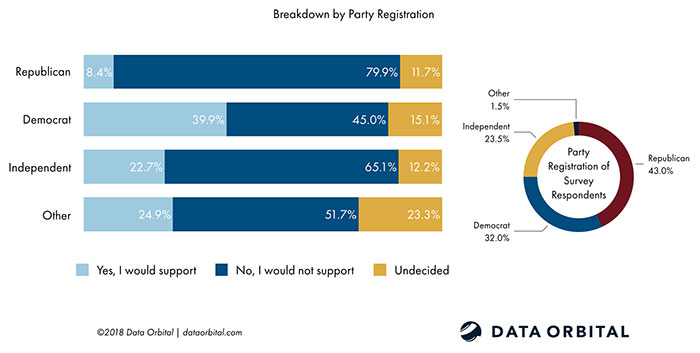
Only 22.1% of voters surveyed support eliminating current border security measures and the existing barriers. Over 64% oppose this with just over 13% of voters still undecided.
Opposition to eliminating current border security leads across parties, with 45% of Democratic voters opposed and Independent opposition at just over 65%. As expected, Republicans came out even stronger with an overwhelming 79.9% opposed.
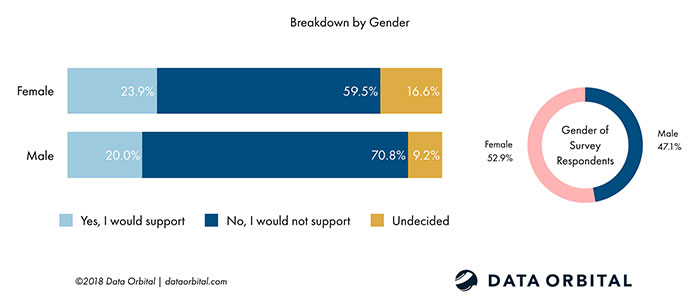
When we dive into the breakdown by gender, we see a majority of both males and females opposed. However, males show stronger opposition at 70.8% while females tend to be more undecided at 16.6%.
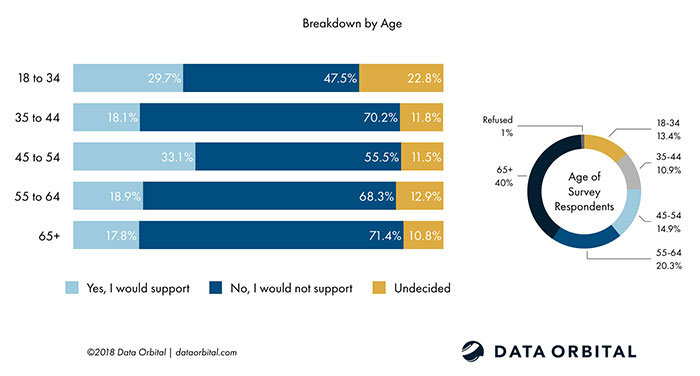
Lastly, we look at the breakdown by age. 18-34 year olds were the only age category where a majority was not opposed. This youngest demographic was also most undecided at 22.8%. As we might expect, older voters, who made up 40% of survey respondents, had the highest opposition at 71.4% followed by 35-44 year olds at 70.2%.
George Khalaf, President of Data Orbital, issued the following statement on these results: “As we look at the sentiment of likely voters toward border security, we see that across party, gender, and age, voters tend to oppose removing the current security measures, including the existing fencing, walls and other physical barriers. With candidates staking out a variety of positions on immigration and border security as the Arizona Primary and November 2018 Midterms approach, the results show that for Arizona voters, current border security measures are a baseline.”
This poll of 550 likely Arizona Republican Primary Election voters was conducted through a live survey that collected 70% of the results from land lines and 30% from cell phones. It has a margin of error at plus or minus 4.18%, with a 95% confidence interval. Respondents were weighted on a number of different demographic figures based off historical Arizona general election turnout. The poll was conducted over two days from August 7th-8th, 2018. All non-released questions prior to questions released would not reasonably be expected to influence responses to the released questions. The questions released are verbatim from the survey provided to respondents.